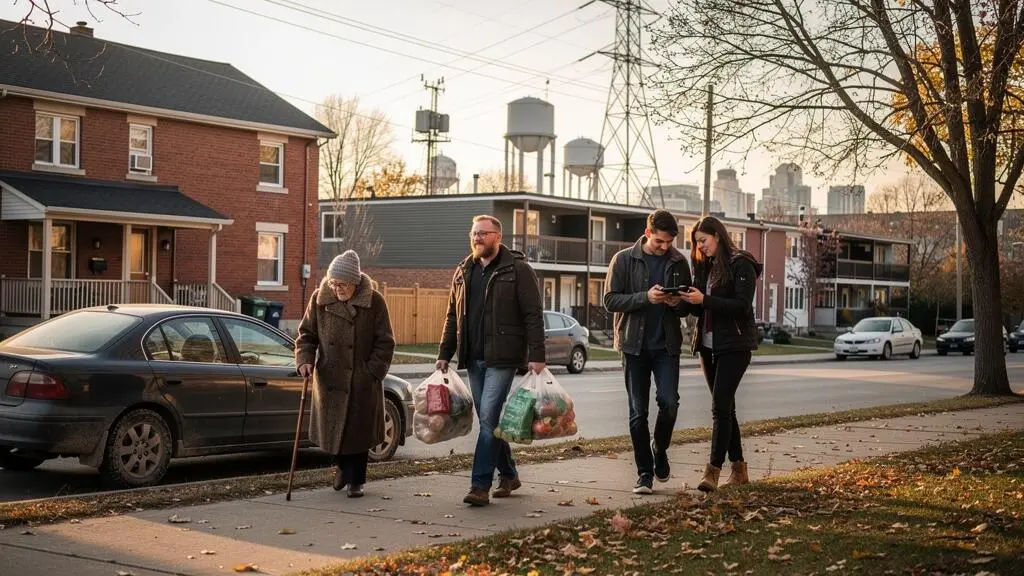
Canadian society is changing through several interconnected forces: population aging, immigration, regional migration, shifting economic opportunities, digital communication and growing pressure on public services. Yet these changes do not unfold uniformly. A young adult in Calgary, a family in suburban Toronto and a retiree in rural Nova Scotia may experience very different versions of the same national transformation.
Understanding these differences requires looking beyond familiar generational labels and urban-rural stereotypes. Housing opportunities, employment structures, provincial policies and local institutions often explain more about everyday experiences than age alone.
Evidence from Statistics Canada also reveals why geographic context matters. The country’s population composition varies considerably between metropolitan centres and smaller communities, while projections point to continued aging and substantial uncertainty about future growth.
A useful picture of contemporary Canada therefore combines demographic evidence with attention to how people form relationships, access services and participate in their communities.
Understanding Canada’s changing social landscape
- Generational experiences reflect economic conditions, life stages and regional opportunities, not simply birth years.
- National demographic trends can conceal major differences between provinces, cities and rural communities.
- Social connection and public-service accessibility depend on local institutions, practical capacity and adaptation to changing needs.
- Why Do Generations Experience Canadian Society So Differently?
- How Can You Tell Whether a Social Change Is National or Mainly Local?
- Urban or Rural Canada: How Different Are Everyday Social Experiences?
- Why Can Social Media Give a Distorted View of Canadian Society?
- How Can Communities Stay Connected as Canadian Society Changes?
- How Can Cities Plan Services Around Population Forecasts Without Overbuilding?
- Online or In-Person Communities: Which Build Stronger Social Connections?
- How Can Canada Keep Public Services Accessible as Demand Grows?
Why Do Generations Experience Canadian Society So Differently?
Canadian generations experience society differently because they entered adulthood under different economic, demographic and institutional conditions. Housing markets, employment opportunities, retirement systems and technology have changed over time. However, age and geography also shape these experiences, so differences between Baby Boomers, Generation X, Millennials and Generation Z cannot automatically be attributed to generational identity.
A central distinction is between an age effect and a cohort effect. An age effect describes experiences associated with a stage of life, such as attending school, raising children or retiring. A cohort effect reflects circumstances shared by people born during a particular period.
Consider someone aged 30 today compared with someone aged 30 in 1985. Both may be navigating career development and family decisions, but the costs of housing, employment arrangements and expectations around education may differ substantially. A meaningful comparison must separate changing economic conditions from the ordinary challenges of being 30.
The timing of major institutional transitions also matters. People who purchased homes under earlier market conditions may have accumulated housing wealth differently from those entering ownership later. Changes to the Canada Pension Plan, including its phased enhancement beginning in 2019, affect contributors according to their working histories and contribution periods. Digital adoption likewise occurred at different life stages.
Geography adds another layer. According to Statistics Canada’s 2021 Census analysis of Canadian generations, Millennials accounted for 23.3% of Alberta’s population, compared with 21.4% for Baby Boomers. Outside large urban centres, however, Baby Boomers represented 29.7% of residents, compared with 17.9% for Millennials.
33.2%
Millennials’ share of Canada’s working-age population, aged 15 to 64, in the 2021 Census. This is a historical census measure, not the population distribution in 2026.
Statistics Canada, 2021 Census of Population, published February 2022.
Such contrasts mean that a generational experience is frequently a generation-plus-region experience. Employment prospects in Alberta’s energy economy, for example, may differ from those in an aging Atlantic community, even for people of similar ages.
Popular descriptions of supposedly entitled younger workers or financially secure older generations ignore the substantial variation within each group. Statistics Canada’s cohort definitions and regional tables offer a stronger starting point than stereotypes, although cross-sectional census figures alone cannot establish why differences arise.
The central lesson is that generational labels are useful demographic categories, not complete explanations of people’s lives. The same caution applies when interpreting social changes presented as national trends.
How Can You Tell Whether a Social Change Is National or Mainly Local?
A social change is more convincingly national when comparable evidence shows it occurring across multiple provinces, territories or population groups over a meaningful period. A trend concentrated in one metropolitan area or linked to one provincial policy may be primarily regional. Identifying the geographic scale, institutional cause and duration helps prevent local experiences from being mistaken for Canada’s overall direction.
Canada’s federal structure is particularly important. Provincial and territorial governments have major responsibilities for health care, education and many social services, while municipalities carry out functions determined largely by provincial legislation. Federal decisions can influence national conditions, but their practical consequences may differ considerably between jurisdictions.
Even national statistics require careful interpretation. Ontario and Quebec account for substantial portions of Canada’s population, so movements within these provinces can influence an aggregate indicator without describing what is happening everywhere.
Three questions provide a useful diagnostic framework.
| Diagnostic | What to examine | What it reveals |
|---|---|---|
| Geographic scale | National, provincial, metropolitan and rural data | Whether change is widespread or geographically concentrated |
| Institutional driver | Federal policy, provincial programs or local economic conditions | Which decisions and institutions may influence the trend |
| Time horizon | Repeated observations rather than a single unusual year | Whether change is persistent or possibly temporary |
For example, a sharp increase in housing demand in one commuter municipality might reflect a local employment development, construction constraints or migration from a nearby city. It would be misleading to assume that the same conditions exist in every Canadian community.
Statistics Canada’s Census Profile allows comparisons across geographic areas, while repeated statistical releases can help establish whether an observed pattern persists. Metropolitan areas such as Toronto, Vancouver and Montréal should also be compared with smaller communities rather than treated as national proxies.
Five steps to verify a Canadian social trend
- Define the claim precisely, including the population and period involved. Produce a one-sentence research question.
- Identify the relevant jurisdiction and policy responsibility. Produce a short list of institutions that may influence the outcome.
- Compare the same indicator across at least three relevant geographic areas where comparable data exist. Produce a small comparison table.
- Check observations from more than one period, using consistent definitions. Produce a dated timeline of the available evidence.
- Document differences, exclusions and uncertainty. Produce a brief conclusion classifying the trend as widespread, concentrated or still uncertain.
This method is especially useful when media coverage focuses on dramatic events in large cities. Public debates about moving, housing or government policy can become distorted when a local circumstance is presented as a universal Canadian experience.
A reliable national picture emerges from comparing places rather than selecting one supposedly representative example. This becomes particularly important when contrasting urban and rural life.
Urban or Rural Canada: How Different Are Everyday Social Experiences?
Urban and rural Canadians often encounter different patterns of transportation, social interaction, service access and community participation. Cities generally offer more specialized institutions and broader networks, while smaller communities may provide greater interpersonal familiarity. Neither setting guarantees stronger relationships or better well-being, and mid-sized cities and commuter communities frequently combine characteristics of both.
Everyday mobility illustrates these differences. In large cities, transit networks and walkable neighbourhoods can make some activities possible without a private vehicle. In dispersed rural areas, driving may be essential for employment, shopping, medical appointments and participation in community activities.
The organization of social life also changes with settlement density. A city resident may encounter numerous strangers while maintaining a relatively small personal network. In a small town, repeated encounters with neighbours, volunteers and local business owners can generate familiarity and mutual recognition.
That familiarity has trade-offs. Stronger local recognition does not necessarily mean broader social opportunities. Some rural residents may benefit from established mutual-support networks but have fewer options for anonymity, specialized services or communities organized around less common interests.
Schools, libraries, places of worship, recreation centres, community halls and hockey rinks can serve as gathering places. Their significance depends less on the building itself than on recurring activities and accessible opportunities to participate.
There is measurable evidence of differences in community belonging. A Statistics Canada study of community belonging among Canadian youth, based on Canadian Social Survey data collected between 2021 and 2024, found that rural residents aged 15 to 29 reporting a strong sense of belonging to their local community 59 % 2021–2024, compared with 50% of urban youth.
The measure captures reported belonging, not the number of friendships, the quality of practical support or the effectiveness of local organizations. It also covers a defined survey population rather than every resident of Canada.
Immigration and internal migration can reshape these experiences. Settlement patterns differ across Canadian regions, and larger metropolitan areas often offer established networks, employment opportunities and services that can attract newcomers. However, the effects of migration depend on local circumstances, including housing availability and community institutions.
Mid-sized cities and suburban commuter belts complicate any simple urban-rural division. Residents may have metropolitan employment connections while relying on neighbourhood organizations or regional facilities for social life.
Ultimately, urban and rural experiences are influenced by accessibility, relationships and local resources. The challenge is distinguishing those lived experiences from the simplified impressions that circulate online.
Why Can Social Media Give a Distorted View of Canadian Society?
Social media can distort perceptions of Canadian society because online visibility does not necessarily reflect population size, public opinion or everyday behaviour. Content selected for attention, emotional engagement or repeated sharing may make unusual conflicts appear commonplace. Understanding the difference between prominent online narratives and representative evidence helps Canadians evaluate claims about social change more critically.
Social media platforms are not designed to reproduce a statistically representative picture of the population. Their recommendation systems organize content around signals such as engagement, relevance and user behaviour. These mechanisms can give emotionally charged disagreements considerable visibility, although the effects vary across platforms, audiences and topics.
Consider a hypothetical dispute over a municipal development project. A relatively small group of highly active users might generate extensive discussion, making the controversy appear to dominate local opinion. Yet the volume of online posts cannot establish how many residents support or oppose the proposal.
This creates an important distinction between online activity and demographic representation. Frequent posting, viral distribution and the prominence of particular accounts are not reliable substitutes for well-designed surveys or population data.
Generational comparisons are particularly vulnerable to this confusion. Discussions depicting young and older Canadians as fundamentally opposed may overlook shared concerns about affordability, health care, public safety and economic security. Establishing the actual distribution of attitudes requires appropriate survey evidence rather than assumptions drawn from online visibility.
A practical way to assess a viral claim is to ask three questions:
- Does the claim describe an observed event, a measured trend or an individual’s interpretation?
- Does the available evidence represent Canadians nationally, or only a particular online audience or geographic area?
- Can the claim be compared with Statistics Canada data, a methodologically documented survey or independently reported regional evidence?
These questions also help distinguish genuine changes in public opinion from changes in the visibility of particular opinions. A topic becoming more prominent online does not necessarily mean that more Canadians have adopted the positions expressed.
Social media remains valuable for discovering concerns, maintaining relationships and hearing perspectives that might receive little attention elsewhere. Its limitation arises when individual experiences are interpreted as representative social measurements.
A more balanced understanding combines online observations with reliable demographic and survey information. The same distinction between visibility and genuine participation matters when communities try to strengthen social connections.
How Can Communities Stay Connected as Canadian Society Changes?
Canadian communities can maintain social connections during demographic change by creating regular opportunities for people to participate, cooperate and develop mutual trust. Shared spaces, volunteer organizations, intergenerational activities and accessible local services can support these relationships. Their effectiveness depends on sustained participation and whether newcomers and established residents can meaningfully participate together.
Population change affects local organizations in different ways. In an aging community, established volunteers may reduce their involvement without younger residents immediately replacing them. In a fast-growing neighbourhood, existing organizations may struggle to accommodate newcomers with different schedules, languages or needs.
Recurring participation is particularly important. A community garden, neighbourhood association or weekly recreation program offers repeated opportunities for residents to recognize one another, exchange information and develop relationships over time.
Spaces outside the home and workplace, sometimes described as third places, can make informal social contact easier. Libraries, cafés, public parks and community centres may provide such opportunities when they are affordable, welcoming and accessible.
Maintaining these spaces requires attention to practical obstacles. Transportation, childcare responsibilities, mobility limitations, language barriers and inconvenient schedules can prevent residents from participating even when activities exist.
Organizations adapting to population turnover can consider several approaches:
- Intergenerational programming that creates opportunities for older and younger residents to contribute together.
- Multilingual communication that makes participation information accessible to newcomers.
- Flexible volunteer opportunities that accommodate employment and caregiving responsibilities.
- Partnerships between established organizations and emerging community groups.
There is also a tension between protecting traditions and responding to changing needs. Established institutions can provide continuity and identity, but participation may weaken if their activities no longer reflect the population they serve. Adaptation need not mean abandoning local traditions; it can involve broadening access and allowing additional forms of participation.
Community resilience should therefore be assessed through observable conditions rather than general appeals to community spirit. Useful indicators include attendance trends, volunteer continuity, the availability of shared spaces and whether new residents have opportunities to become involved.
Statistics Canada’s findings on local belonging provide relevant context, including differences by age and settlement type. However, the survey does not establish that any particular community program directly causes stronger social cohesion.
Strong communities are not necessarily those that experience the least demographic change. They are communities capable of maintaining meaningful participation while adapting their institutions to evolving needs. Municipal planning faces a similar challenge when deciding how much infrastructure future residents will require.
How Can Cities Plan Services Around Population Forecasts Without Overbuilding?
Canadian cities can reduce the risk of overbuilding by treating population projections as conditional scenarios rather than guaranteed outcomes. Phased development, adaptable facilities and regular reassessment allow municipalities to respond as demand becomes clearer. Planning must also distinguish essential infrastructure that is costly to undersize from facilities where unused capacity creates substantial long-term financial obligations.
Population growth creates difficult decisions because municipal infrastructure often requires years of planning, approvals and construction. A water-treatment facility, recreation centre or transit corridor may need to serve residents for decades, yet the number and location of future users remain uncertain.
Recent growth rates are not sufficient by themselves to determine future capacity. Migration patterns can change, new residential developments can be delayed, and federal immigration policies can alter demographic assumptions.
Statistics Canada’s 2025–2075 population projections, published in January 2026, illustrate this uncertainty through multiple scenarios rather than a single predetermined trajectory.
44.0–75.8 million
Canada’s projected population in 2075 under the low-growth and high-growth scenarios. These figures represent alternative demographic assumptions, not a confidence interval or guaranteed forecast.
Statistics Canada, Population Projections for Canada, published January 2026.
Although these are national projections, they demonstrate why planners should examine a range of possible futures. Provincial scenarios offer additional context, but neither national nor provincial estimates can establish how many residents will live in a particular neighbourhood.
Scenario planning allows municipalities to evaluate different development paths. Rather than designing every facility around one expected population figure, planners can compare lower-growth, central and higher-growth assumptions and assess the consequences of each.
The practical response depends on the infrastructure involved.
| Service or facility | Main capacity risk | Possible planning approach |
|---|---|---|
| Water and wastewater systems | Insufficient capacity can constrain development and essential services. | Protect critical capacity while evaluating expandable system designs. |
| Schools | Rapid neighbourhood growth can create overcrowding. | Coordinate enrolment scenarios, school-board planning and flexible capacity. |
| Recreation facilities | Large facilities can generate long-term operating costs if underused. | Consider phased construction, shared spaces and adaptable layouts. |
| Public transit | Demand may develop differently from projected travel patterns. | Review actual ridership and development before committing to later expansion phases. |
These are planning approaches, not guarantees of lower costs. Their suitability depends on engineering requirements, financing, land availability and the consequences of inadequate service capacity.
Canadian municipalities must also account for policy-driven demographic uncertainty. The federal government’s 2026–2028 Immigration Levels Plan targets 380,000 permanent resident admissions annually, while separately setting targets for new temporary resident arrivals. These are policy intentions rather than observed population outcomes, and their effects on individual cities depend on settlement choices and other demographic factors.
Reviewing assumptions at regular intervals can help cities distinguish temporary demand fluctuations from sustained change. An investment strategy should consider not only construction expenditure but also staffing, maintenance and future operational requirements.
The objective is not to eliminate every possibility of unused space. It is to preserve access to essential services while avoiding unnecessary long-term commitments. Alongside physical infrastructure, cities also need to consider how residents form the networks that make those services and communities useful.
Online or In-Person Communities: Which Build Stronger Social Connections?
Neither online nor in-person communities are universally stronger. Digital networks can help people find others with shared interests, exchange information and maintain relationships across long distances. In-person connections often offer advantages for practical assistance and repeated local interaction. The strongest arrangement may combine both, provided participation develops into trustworthy, reciprocal relationships.
Online communities can connect Canadians whose interests, experiences or identities are not widely represented where they live. Someone in a remote community may find relevant discussions, mentorship or emotional understanding through networks extending across provinces.
These relationships can be meaningful even without geographic proximity. Digital communication may also sustain family and friendship networks when people move for education, employment or other reasons.
However, access to a large online network is not equivalent to reliable practical support. A group may provide helpful information while being unable to assist someone with transportation, childcare or an urgent local problem.
In-person communities have different strengths. Frequent encounters and shared responsibilities may create opportunities for practical cooperation. Neighbours, volunteers and local organizations can sometimes offer assistance that depends on physical proximity.
Yet in-person participation is not automatically inclusive. People with disabilities, limited transport options, demanding work schedules or few local peers may face substantial barriers. Digital connections can help overcome some of these constraints.
The distinction is better understood by comparing the functions of social networks.
| Connection dimension | Online communities | In-person communities |
|---|---|---|
| Geographic reach | Can connect people across regions and countries. | Often centred on a neighbourhood or shared physical location. |
| Shared interests | Can bring together people with specialized or uncommon interests. | May offer broader everyday interaction across different interests. |
| Practical assistance | Can coordinate information, fundraising or referrals. | Can facilitate direct, location-dependent assistance. |
| Participation barriers | May require connectivity and digital literacy. | May require transportation, accessible venues and compatible schedules. |
A hybrid approach can combine these advantages. A neighbourhood organization might use a messaging group to announce events, coordinate volunteers and maintain contact between meetings. Online participation then becomes a tool supporting local activity rather than a substitute for it.
One useful personal test is reciprocity: if a serious difficulty arose, which connections could provide information, emotional reassurance or concrete help? The answer may involve both distant digital relationships and nearby contacts.
Statistics Canada’s community-belonging research describes reported connections to local communities, but it does not directly compare the effectiveness of online and face-to-face networks. Claims that one form consistently produces stronger relationships therefore require additional evidence.
Meaningful connection is defined less by the communication channel than by continuity, trust and willingness to support others. These principles also matter for public institutions, which increasingly combine digital access with physical service delivery.
Key takeaways for Canada’s next social challenges
- Public-service planning must reflect differences in age, settlement patterns and regional growth rather than relying on national population totals alone.
- Digital access is useful only when residents can actually complete essential tasks, including those who need assistance or accessible alternatives.
- Service sustainability depends on workforce capacity, geographic coverage and coordination between institutions, not simply announced spending.
How Can Canada Keep Public Services Accessible as Demand Grows?
Canada can maintain access to public services by aligning staffing, facilities, delivery methods and funding with changing regional needs. Population growth and aging create different pressures across communities, requiring flexible responses rather than a uniform national solution. Accessibility must be assessed through actual availability, including waiting times, geographic reach, language support and effective alternatives to digital-only services.
Demand for services changes as populations grow older, move between regions or settle in newly developing neighbourhoods. A growing suburban community may need additional school capacity and family services, while an aging region may face greater demand for home care, specialized health services and accessible transportation.
The demographic challenge is substantial. Statistics Canada’s 2026 projection report estimated that residents aged 65 or older as a share of the population 19.5 % 2025. Across its alternative scenarios, the share of people aged 65 or older in 2075 ranges from 22.6% to 32.5%.
Those figures do not determine service requirements on their own. Actual demand also depends on health conditions, service use, workforce supply and regional delivery systems.
Access is not the same as funding. A service may have an allocated budget yet remain difficult to use because appointments are unavailable, travel distances are excessive or suitable professionals cannot be recruited.
Consider a hypothetical regional clinic receiving additional funding. If qualified staff remain unavailable, the clinic may be unable to expand appointment capacity proportionately. The financial allocation and the operational result are separate questions.
Workforce policies are therefore central to the debate. Recruiting professionals, recognizing suitable international qualifications and reviewing professional scopes of practice may help address capacity constraints, subject to applicable provincial rules, professional standards and patient-safety requirements.
Regional consolidation presents another trade-off. Concentrating specialized services in fewer locations may help institutions organize scarce expertise, equipment and staffing. However, it can also increase travel burdens for rural residents, especially those with limited transportation or mobility.
Digital-first services can simplify some administrative interactions and reduce the need for routine travel. Nevertheless, they can exclude residents who lack reliable internet access, appropriate devices, confidence using online systems or accessible interfaces.
A resilient service model may therefore combine online options with telephone assistance and accessible in-person channels. The appropriate balance depends on the service, the users and the consequences of being unable to obtain help.
Canada’s institutional structure adds another consideration. Federal transfers may help support provincial and territorial programs, but financing arrangements do not automatically resolve local staffing shortages or operational barriers. Effective coordination requires clear responsibilities and an understanding of how services are delivered.
Performance measurement should consequently extend beyond expenditure totals. Relevant indicators may include appointment availability, waiting periods, travel requirements, language accessibility, staff vacancies and the proportion of residents able to complete essential transactions.
No single measure captures the full experience. Shorter waits at a centralized facility, for example, may coincide with longer journeys for some patients. Evaluating access requires attention to these trade-offs and the residents most affected.
A practical starting point is to identify one essential local service, review available information about demand and access, and compare those findings with the needs of different age groups. This connects Canada’s broad demographic transformation to the everyday question that matters most: whether residents can obtain the support they need when they need it.
Is Canada’s population expected to keep aging?
Yes. Statistics Canada’s population projections published in January 2026 anticipate an increasing share of older residents under the scenarios examined. People aged 65 or older represented an estimated 19.5% of the population in 2025, with a projected share ranging from 22.6% to 32.5% in 2075. These are conditional scenarios, not guaranteed future outcomes.
Does population growth affect every Canadian province equally?
No. Provincial population trends differ because of migration, birth and death patterns, age structures and economic circumstances. Statistics Canada’s projections indicate that provinces may account for different shares of Canada’s population over time. Municipal conditions can also differ substantially from provincial averages.
Does a strong sense of community belonging mean people have reliable social support?
Not necessarily. A strong sense of belonging describes how connected individuals feel to their local community. It does not directly establish whether they have dependable friendships, access to volunteers or someone available to help during an emergency. Understanding practical support requires additional information about relationships and local resources.
Can population projections accurately predict the needs of a particular neighbourhood?
National and provincial projections provide useful demographic context, but they cannot independently determine neighbourhood-level demand. Local decisions require information about housing development, migration, household composition, existing infrastructure and service use. Comparing several scenarios helps planners manage uncertainty.
What indicators can show whether a Canadian community is adapting successfully?
Useful indicators include participation in community organizations, access to shared spaces, opportunities for newcomers to become involved, service waiting times and geographic accessibility. Comparing these measures over time can reveal strengths and pressures, although no individual indicator proves that a community is successfully adapting in every respect.