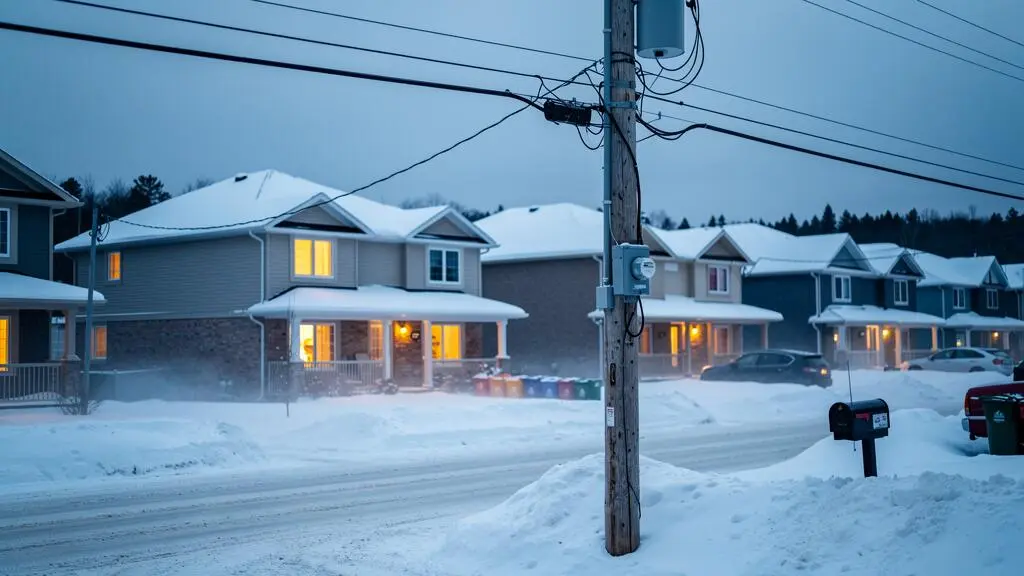
Energy consumption across Canada reflects more than cold winters. Industrial activity, transportation distances, building characteristics, heating systems, electricity generation and energy prices all influence how much energy Canadians use. These factors also explain why energy demand can differ sharply between provinces, businesses and otherwise similar households.
The distinction between electricity and total energy matters. A household heated electrically may record substantial electricity consumption, while another relying on natural gas could use less electricity without necessarily using less energy overall. The same distinction applies nationally: industrial fuels and transportation account for substantial demand that household electricity statistics cannot capture.
According to the Canada Energy Regulator, industry represented 53% of Canadian end-use energy demand in 2020, followed by transportation at 20%, residential uses at 14% and commercial uses at 13%. Those historical figures illustrate why understanding Canada’s energy consumption requires looking beyond homes and power bills.
For households and businesses, useful decisions begin with identifying what consumes energy, distinguishing unavoidable demand from inefficient operation, and comparing realistic improvements under local conditions.
Canadian energy consumption at a glance
- Climate, buildings, industrial activity, transport and regional fuel choices jointly determine energy demand.
- Heating is a major opportunity for residential efficiency, but electricity bills alone do not reveal total household energy use.
- Energy upgrades, operating habits and renewable technologies should be evaluated against local consumption patterns, tariffs and seasonal conditions.
- Why Do Canadians Use So Much More Energy in Some Regions Than Others?
- How Can You Find the Biggest Energy Users in Your Home?
- Efficiency Upgrades or Habit Changes: Which Cut Energy Use More?
- Why Can Energy Use Stay High After an Efficiency Upgrade?
- When Does Higher Energy Consumption Signal an Efficiency Problem?
- How Can Households Identify Where Carbon Costs Affect Their Budget Most?
- Wind or Solar: Which Works Better Under Canadian Weather Conditions?
- Which Sustainable Energy Sources Fit Canada’s Regional Energy Needs Best?
Why Do Canadians Use So Much More Energy in Some Regions Than Others?
Energy consumption varies across Canadian regions because heating requirements, housing characteristics, economic activity, transportation distances and available fuels differ. Provincial electricity systems and energy prices add another layer: two households with similar heating needs can use different fuels and face different costs. Comparing electricity alone therefore gives an incomplete picture of regional energy demand.
Winter temperatures are a major influence on residential consumption. Heating degree-days measure how much and how long outdoor temperatures fall below a reference temperature. Regions with more heating degree-days generally face greater heating requirements, although insulation, building design and thermostat settings determine how strongly that climate translates into actual consumption.
Summer cooling demand introduces a second seasonal consideration. Homes in warmer urban areas may experience substantial electricity demand during hot periods, particularly when air conditioning is widespread.
Building size and urban form also matter. Larger detached homes generally have more space to heat than compact apartments, while shared walls can reduce heat loss. Less densely populated areas may require longer personal or commercial journeys, increasing transportation energy demand.
The Canada Energy Regulator’s provincial and territorial energy profiles illustrate another important distinction: electricity consumption differs considerably between jurisdictions, but electricity use is not interchangeable with total energy demand.
14.6 MWh
Average annual Canadian electricity consumption per capita in 2020. Quebec recorded 22.9 MWh per capita, compared with 6.1 MWh in Nunavut. These figures cover electricity consumption across sectors, not household electricity use alone.
Canada Energy Regulator, historical provincial and territorial energy profiles.
Energy sources help explain these comparisons. Electric heating is common in Quebec, natural gas is important in Prairie heating markets, and some Atlantic households use heating oil. A residence using natural gas can show relatively modest electricity demand while still consuming considerable heating energy.
Provincial tariff structures further influence behaviour. Lower electricity rates can make electric heating financially attractive, while higher rates or time-sensitive pricing can encourage load management. Price differences do not necessarily indicate differences in efficiency, and provincial averages do not establish an individual household’s carbon footprint.
To assess regional consumption fairly, compare local heating degree-days, dwelling type, floor area, main heating fuel and applicable electricity or gas tariff. For businesses, add operating hours, industrial processes and transportation requirements.
Once regional conditions are understood, the more useful question is which activities and systems account for energy demand inside a particular building.
How Can You Find the Biggest Energy Users in Your Home?
The biggest energy users in a Canadian home are usually space heating and water heating, although the exact ranking depends on climate, heating fuel and household equipment. Begin by separating electricity, natural gas and other fuel consumption, then examine seasonal patterns and meter readings. A useful home energy assessment identifies the largest loads before targeting smaller appliances.
The Canadian Centre for Energy Information reports that space and water heating together represented 79 % of Canadian residential energy consumption in 2023 data. This national figure explains why a household concentrating exclusively on lighting or electronics may overlook its greatest opportunities.
Heating demand is strongly seasonal. A sharp rise during winter can be entirely consistent with local weather, while relatively steady consumption throughout the year can point toward water heating, refrigeration, ventilation or permanently operating electronics.
Start with bills covering several billing periods. Record the amount of energy consumed, not only the amount charged. Electricity is commonly reported in kilowatt-hours, natural gas may be billed in cubic metres or energy units, and delivered heating fuels require separate records.
Where smart-meter data is available through a utility portal, inspect daily and hourly patterns. A persistent overnight electricity load can reveal equipment operating continuously, but refrigerators, ventilation systems and other essential devices contribute legitimate baseline consumption.
A basic diagnostic can use meter readings taken at consistent times over several days. Compare ordinary operation with periods when selected, safely accessible appliances are switched off. Plug-in electricity monitors can help assess suitable devices, but they cannot measure central heating loads supplied by natural gas.
Never open electrical panels, interfere with utility meters or disconnect essential equipment to perform these checks. Electrical work and gas-system testing belong to qualified professionals.
EnerGuide home evaluations offer another perspective by assessing building characteristics and estimated energy performance. Their results can help identify heat-loss problems that individual appliance measurements may miss. Actual utility consumption and modelled EnerGuide results serve different purposes and should not be treated as identical measurements.
Build a five-step home energy-use inventory
- Collect recent electricity and heating-fuel bills. Deliverable: one record of consumption by billing period and energy source.
- Record the dwelling’s floor area, heating equipment and main occupants’ schedules. Deliverable: a basic household energy profile.
- Compare winter, summer and milder-season consumption. Deliverable: a seasonal chart showing the periods of highest demand.
- Review available smart-meter data and safely test selected plug-in appliances. Deliverable: a shortlist of significant or persistent electricity loads.
- Identify whether heating, water heating or another system deserves investigation first. Deliverable: a prioritized list of three potential efficiency actions.
In a poorly insulated home, the building envelope may be the underlying cause of excessive heating consumption. Replacing small electrical devices will not solve substantial heat losses through walls, windows, roofs or uncontrolled air leakage.
With that evidence, a household can choose between modifying daily behaviour and investing in equipment or building improvements.
Efficiency Upgrades or Habit Changes: Which Cut Energy Use More?
Efficiency upgrades generally offer greater potential when a building or major system wastes energy, while habit changes can reduce consumption quickly and with little upfront expense. Insulation, heating equipment and water-heating improvements address structural demand. Thermostat settings, lighting routines and appliance use influence daily operation. The strongest strategy combines both according to the household’s largest energy loads.
The distinction is important. An efficiency upgrade reduces the energy required to deliver a given service. Better insulation, for example, helps maintain indoor temperature with less heating energy under comparable conditions.
A habit change usually alters when or how much of that service is used. Reducing unnecessary heating in unoccupied rooms, avoiding prolonged hot-water use or switching off unused equipment can lower consumption without changing the technology itself.
The Energy Fact Book’s energy efficiency statistics show the importance of efficiency to Canada’s long-term energy trajectory. Between 2000 and 2023, recorded residential energy consumption declined by 1%. The published analysis estimates that consumption would instead have increased by 37% without efficiency improvements.
That counterfactual estimate describes national trends, not the savings any individual renovation can guarantee.
For practical decisions, consider the following differences.
| Energy use | Efficiency investment | Habit adjustment |
|---|---|---|
| Space heating | Improve insulation, air sealing or heating-system efficiency | Use suitable thermostat schedules and avoid unnecessary heating |
| Water heating | Improve water-heater efficiency or appropriate insulation | Reduce unnecessary hot-water use |
| Lighting | Install efficient lighting where needed | Switch off lights in unused spaces |
| Electronics | Choose efficient replacement devices | Reduce unnecessary standby and operating time |
| Business operations | Upgrade inefficient machinery or building systems | Optimize operating schedules and equipment use |
Financial comparisons require more than estimating energy savings. Calculate the upfront investment, maintenance requirements, expected equipment life and likely reduction in billed consumption. Fixed charges, different fuel prices and time-dependent tariffs can make the dollar savings differ from the percentage reduction in energy use.
Federal and provincial incentive programs may alter the economics, but eligibility, availability and application requirements must be checked before committing to work. Do not assume a previously advertised grant remains open.
For a building with serious heat loss, improving insulation and air sealing may deserve attention before minor appliance optimizations. The order of upgrades should reflect building condition, ventilation requirements, equipment compatibility and available capital.
Even technically sound improvements, however, do not guarantee that total energy consumption will fall exactly as predicted.
Why Can Energy Use Stay High After an Efficiency Upgrade?
Energy consumption can remain high after an efficiency upgrade because the building still loses heat, equipment operates incorrectly, household behaviour changes or weather conditions differ from the original comparison period. An efficient system may also deliver more heating or cooling than before. Evaluating an upgrade therefore requires measuring actual energy use under comparable conditions rather than relying on bills alone.
One explanation is the rebound effect. When an energy service becomes cheaper or easier to provide, occupants may use more of it. A household installing a more efficient heating system might subsequently increase thermostat settings or heat rooms that were previously kept cooler.
This does not mean the improvement was ineffective. Energy consumption per unit of heating service may have fallen even if total household consumption changed relatively little.
Technical problems offer another explanation. Incorrect equipment sizing, installation faults, unsuitable controls and unresolved air leakage can prevent expected performance. A heat pump operating inefficiently because of configuration problems may consume more electricity than anticipated, while an insulated building with untreated thermal bridges can still experience substantial losses.
Heating fuel switching complicates comparisons further. Replacing a gas furnace with an electric heat pump may increase electricity consumption while reducing or eliminating natural gas use for space heating. Comparing only the electricity bill would misrepresent the overall change.
For a meaningful evaluation, track total delivered energy by fuel, indoor comfort, equipment operation and relevant weather conditions.
A simple before-and-after comparison should include:
- Consumption during equivalent seasonal periods before and after the work.
- Heating or cooling degree-days for both periods.
- Changes in occupancy, operating schedules and thermostat settings.
- Any switching between electricity, natural gas and other heating fuels.
- Installation records, commissioning results and equipment maintenance findings.
Weather normalization is particularly important. A colder winter can increase heating demand even after an effective retrofit. Dividing heating-related consumption by heating degree-days can provide an initial comparison, although base loads, equipment behaviour and non-linear effects mean the result is only an approximation.
For complex buildings, professional energy modelling or measurement and verification can provide a more reliable assessment.
Where financial assistance depends on a pre-retrofit evaluation, approved improvements or a post-retrofit assessment, those requirements must be confirmed before starting. Missing a required evaluation can affect eligibility independently of actual energy performance.
If consumption remains unusually high after these factors are considered, the next task is determining whether the building or equipment has developed an efficiency problem.
When Does Higher Energy Consumption Signal an Efficiency Problem?
Higher energy consumption suggests an efficiency problem when it persists after accounting for weather, occupancy, building use and equipment changes. A single expensive winter bill is not sufficient evidence. Repeated increases under comparable conditions, especially alongside poor comfort or unusual equipment operation, justify further investigation before inefficiency causes additional expense or equipment damage.
Some consumption increases are expected. A colder winter raises heating requirements; additional occupants can increase water-heating and appliance demand; and a new electric vehicle can significantly change electricity use without indicating any building fault.
More concerning patterns include rising consumption across comparable seasons, unexpectedly high overnight loads, or heating equipment running extensively without maintaining the desired indoor temperature.
Physical symptoms can help narrow the investigation:
- Short, frequent equipment cycles: possible control, sizing, airflow or maintenance problems.
- Rooms that remain difficult to heat: potential insulation, air leakage, distribution or system-balancing issues.
- Unusual frost or ice buildup: possible operating or airflow problems, although normal defrost behaviour must be distinguished from a fault.
- Continuous water-heater operation: possible high hot-water demand, heat loss, a leak or malfunction.
- Unexpected electricity consumption at night: a reason to inspect scheduled equipment and other continuous loads.
These symptoms are diagnostic clues, not proof of a particular defect. Some represent normal operation under specific conditions, so manufacturer guidance and professional assessment matter.
A practical personal threshold comes from the building’s own history rather than an arbitrary national figure. Compare monthly energy consumption against previous years, adjusting for weather and major usage changes. Where possible, review similar dwellings or an EnerGuide assessment for additional context.
For businesses, normalize energy use against a relevant activity measure, such as operating hours or production volume. A factory producing more goods may use more total energy while becoming more efficient per unit produced.
Persistent faults can have consequences beyond consumption. Restricted airflow, poorly maintained equipment or repeated abnormal cycling may accelerate wear and ultimately require costly repairs.
Arrange qualified service when unusual operating behaviour continues, and treat suspected electrical or combustion hazards as safety concerns rather than ordinary efficiency questions.
Once technical causes are separated from normal demand, households can also examine why the same amount of energy may create different financial pressures over time.
How Can Households Identify Where Carbon Costs Affect Their Budget Most?
Households can identify their greatest exposure to carbon-related costs by examining transportation fuels, heating fuels and the prices of energy-intensive goods and services. However, Canada’s carbon pricing arrangements changed in 2025: the federal consumer fuel charge ended on April 1 of that year. Current costs must therefore be distinguished from historical fuel charges, provincial policies and indirect industrial carbon-pricing effects.
Gasoline, diesel, natural gas and heating oil can represent significant household fossil-fuel expenditures. Their prices reflect several components, including energy markets, distribution, taxes and applicable policy measures. It would be inaccurate to attribute every increase in a fuel bill to carbon pricing.
According to the Department of Finance Canada’s explanation of the 2025 consumer carbon price removal, federal fuel charge rates were set to zero after March 31, 2025. The federal government also removed the requirement for provinces and territories to maintain consumer-facing carbon pricing.
Industrial carbon pricing remained a distinct policy area. Provincial arrangements and measures affecting large emitters should not be confused with the former federal charge directly applied to consumer fuels.
For households, the most useful approach is to build a fuel-exposure budget rather than assume that an identifiable carbon charge applies uniformly across Canada.
| Budget category | What to examine | Important distinction |
|---|---|---|
| Personal transportation | Fuel purchases, annual distance and vehicle consumption | Fuel-market costs and applicable taxes are not automatically carbon charges |
| Home heating | Heating fuel, annual consumption and local tariffs | Electricity and fossil-fuel heating have different direct pricing structures |
| Purchased goods | Energy-intensive or transportation-dependent expenditures | Indirect carbon-pricing effects are difficult to isolate from other price changes |
| Household services | Delivery, transport and energy-related service fees | Supplier pricing does not necessarily disclose individual policy cost components |
Begin with measured annual fuel consumption and spending. Then identify which charges are explicitly itemized and which potential costs are embedded in market prices. Any estimate of indirect industrial carbon-pricing effects should acknowledge that the available evidence does not establish a household-specific pass-through amount.
The final Canada Carbon Rebate payments for eligible individuals began in April 2025. Those historical payments should not be presented as ongoing federal quarterly rebates in 2026. Any currently applicable provincial benefit, credit or pricing mechanism requires confirmation against the relevant government’s rules.
A household considering an electric vehicle or heating-system change should compare expected total operating costs, capital costs and energy requirements, rather than base its decision on an assumed carbon charge.
Reducing exposure to fossil-fuel costs may involve using less energy, changing equipment or obtaining electricity from lower-emission sources, but the most suitable choice depends on regional conditions.
Wind or Solar: Which Works Better Under Canadian Weather Conditions?
Solar and wind energy perform differently across Canada, and neither is universally superior. Solar generation depends on sunlight, roof conditions and seasonal daylight, while wind generation depends on local wind speeds, exposure and turbine characteristics. The better option depends on whether the goal is maximum annual production, winter energy supply, household self-consumption or greater independence from the electricity grid.
Solar panels can operate efficiently in cold temperatures, but shorter winter days, low sun angles and snow coverage can reduce seasonal production. A bright, cold day may still provide useful electricity, so low temperature alone does not establish poor solar performance.
Site conditions matter as much as provincial averages. Roof orientation, shading, available area, structural suitability and snow accumulation influence photovoltaic output. Two properties in the same municipality can consequently have very different production potential.
Wind energy presents different opportunities. Some coastal and Prairie locations offer favourable wind resources, including periods when solar output is limited. However, wind generation remains variable, and a regional wind-resource map cannot establish the output of a turbine installed at a particular home.
Residential turbines need appropriate exposure, sufficient space, suitable structures and ongoing maintenance. Buildings, trees and terrain can create turbulence that reduces production or increases mechanical stress.
For a grid-connected residence, solar is often simpler to assess because roof characteristics and solar-resource data provide a practical starting point. This does not establish that solar will be economical at every property or that wind is unsuitable wherever solar is available.
Compare the technologies using the same evaluation criteria:
| Criterion | Solar photovoltaic | Small wind turbine |
|---|---|---|
| Primary resource | Solar radiation and daylight | Local wind speeds and exposure |
| Winter considerations | Shorter days, lower sun angles and snow | Variable seasonal winds, icing and severe weather |
| Property requirements | Suitable roof or ground-mounted area | Adequate clearance, exposure and structural support |
| Maintenance | Inspection and system upkeep | Mechanical inspection and potentially greater servicing needs |
| Economic evaluation | Hourly production, electricity tariff and export rules | Measured wind resource, generation profile and maintenance costs |
For either technology, annual electricity output is only part of the calculation. A household with substantial winter heating demand must examine when energy is produced, not simply how much is generated over a year.
Storage, electricity exports and grid connection arrangements can change financial outcomes. Permits, zoning, utility interconnection requirements and compensation for exported electricity must be checked locally before investing.
Off-grid applications require additional planning because intermittent generation alone cannot guarantee continuous electricity supply. Backup generation, storage capacity and critical loads become central design considerations.
For the wider energy system, these technologies must also be considered alongside established generation sources, grid capacity and each region’s particular resources.
Key takeaways for regional energy decisions
- Match energy sources to the province’s natural resources, seasonal demand and existing electricity system.
- Evaluate household installations separately from large-scale provincial generation strategies.
- Consider demand reduction and efficient electrification before assuming that additional renewable generation is the only solution.
Which Sustainable Energy Sources Fit Canada’s Regional Energy Needs Best?
The most suitable sustainable energy sources differ across Canada because water resources, wind conditions, solar potential, heating requirements and electricity infrastructure vary by region. Hydroelectricity is especially important in several provinces, while wind, solar, sustainable bioenergy and geothermal technologies can serve complementary roles. The most effective regional approach combines appropriate generation with energy efficiency, flexible demand and dependable infrastructure.
Canada’s electricity system already demonstrates how geography shapes supply. The Canada Energy Regulator reported that approximately hydroelectricity 60 % of Canadian electricity generation came from hydroelectricity in 2021. Its historical profile identifies British Columbia, Manitoba, Quebec, and Newfoundland and Labrador as provinces where hydroelectricity typically represented more than 85% of generation.
Those figures describe electricity production, not the complete energy used in transportation, industrial processes or building heating. Provincial generation also does not necessarily match the exact electricity mix delivered to every consumer, because electricity can be imported or exported between jurisdictions.
Hydroelectricity offers substantial generation capacity in provinces with suitable water resources and established infrastructure. Certain hydroelectric facilities can also provide operational flexibility, helping electricity systems respond to changes in demand or variable renewable generation.
Wind energy can complement existing systems where wind resources, transmission capacity and environmental conditions are favourable. Solar generation can support distributed electricity production and some utility-scale projects, although winter output may not coincide with peak heating requirements.
Bioenergy may be relevant where sustainable forestry, agricultural residues or organic waste streams are available. Its environmental performance depends on feedstock sourcing, emissions and the complete production process; it should not automatically be treated as carbon-neutral.
Geothermal technologies require another distinction. Ground-source heat pumps use underground temperatures to provide efficient building heating and cooling, while geothermal electricity generation requires suitable geological conditions and involves different infrastructure.
Regional strategies also depend on what energy demand must be served:
- Hydroelectric provinces: assess opportunities for efficient electrification, grid improvements and complementary generation.
- Wind-resource regions: evaluate wind projects against transmission availability, seasonal output and local environmental constraints.
- Solar-suitable sites: examine generation profiles, daytime electricity use and grid connection arrangements.
- Remote communities: consider locally appropriate renewable generation alongside storage, backup and system reliability.
- Industrial regions: combine cleaner electricity with process efficiency and technologies suited to industrial heat and fuel requirements.
The challenge is not simply choosing the renewable technology with the greatest theoretical potential. Electricity systems must meet demand continuously, including during winter peaks, low-wind periods and disruptions. Storage, transmission interconnections, demand flexibility and dependable generation all influence how renewable sources can be integrated.
Household decisions operate at another scale. A homeowner may achieve more immediate benefits by improving insulation or upgrading an inefficient heating system than by installing on-site generation. A business may prioritize energy monitoring, process optimization or suitable electrification before investing in electricity production.
For each proposed change, compare the energy service required, the existing fuel, the available technology, total costs and expected emissions implications. Use local electricity characteristics rather than assuming that every additional kilowatt-hour has the same environmental impact across Canada.
The practical next step is to establish a measured energy baseline, identify avoidable demand, and compare locally suitable efficiency and supply options using current utility tariffs and verified technical requirements. This produces a more useful decision than relying on a national ranking of energy sources.
What is the difference between primary and secondary energy consumption?
Primary energy refers to energy resources before conversion into other energy forms, while secondary or end-use energy accounting focuses on energy available or consumed after relevant conversion processes, depending on the statistical framework. Canada’s reported primary energy use was 12,538 petajoules in 2023, compared with 9,093 petajoules of secondary energy use in the Energy Fact Book. These indicators should not be compared as though they measure identical stages of the energy system.
Why can electricity consumption rise even when a home becomes more energy efficient?
Electricity consumption may increase when a household replaces gas-powered heating with electric equipment, adds an electric vehicle or changes its operating patterns. Efficiency should be assessed using total energy consumption, the services delivered and relevant changes in fuel use, rather than electricity readings alone.
How should small businesses compare energy use between different locations?
Businesses should separate energy sources and compare consumption against floor area, operating hours, production volumes or another relevant activity measure. Climate, building condition and equipment loads also matter. A location using more energy overall may still be more efficient if it supports substantially greater activity.
Does renewable electricity automatically make a building energy efficient?
No. Renewable electricity changes how energy is supplied, while efficiency concerns how much energy is needed to deliver heating, cooling, lighting and other services. A poorly insulated building can consume excessive energy even if some or all of its electricity comes from renewable generation.
Which information should households collect before planning an energy retrofit?
Collect electricity and heating-fuel consumption records, building characteristics, heating-equipment details, information about comfort problems and relevant seasonal weather data. An appropriate professional energy evaluation can identify building-envelope and system issues. Before hiring contractors, verify applicable incentive eligibility, required assessments and documentation.